††† The Digit Symbol subtest of the WAIS and WISC intelligence tests is another relatively pure test of mental speed. The so-called concentration test, ‘d2 test’, on fact is an intelligence test,
as Westhoff and Kluck (1983) showed empirically: d2 correlates at around r = 0.60 with various intelligence tests in each of the two studies (N1 = 89, N2 = 106). Even generating random numbers contains a component of mental speed when the time for a single choice
is limited to a second. Therefore, it correlates moderately with global IQ (Dieminger, 1988; Waddell, Benjamin and Kemp, 1985).
††† Speed of information processing is hypothesized here to be the common denominator of all the above tests. In samples, correlations between these simple tasks and global IQ vary within a wide range of r = 0.20-0.82. Under favourable
conditions (with reliable measures and a full range of intelligence levels
among subjects), average correlations of about 0.70 can be expected. For
example, in seven representative samples the Number Sequence Test correlated
between 0.69 and 0.82 with global intelligence tests (Oswald and Roth, 1978).
In summary, we conclude that the overall correlation of speed of information
processing with global intelligence is substantial.
†††
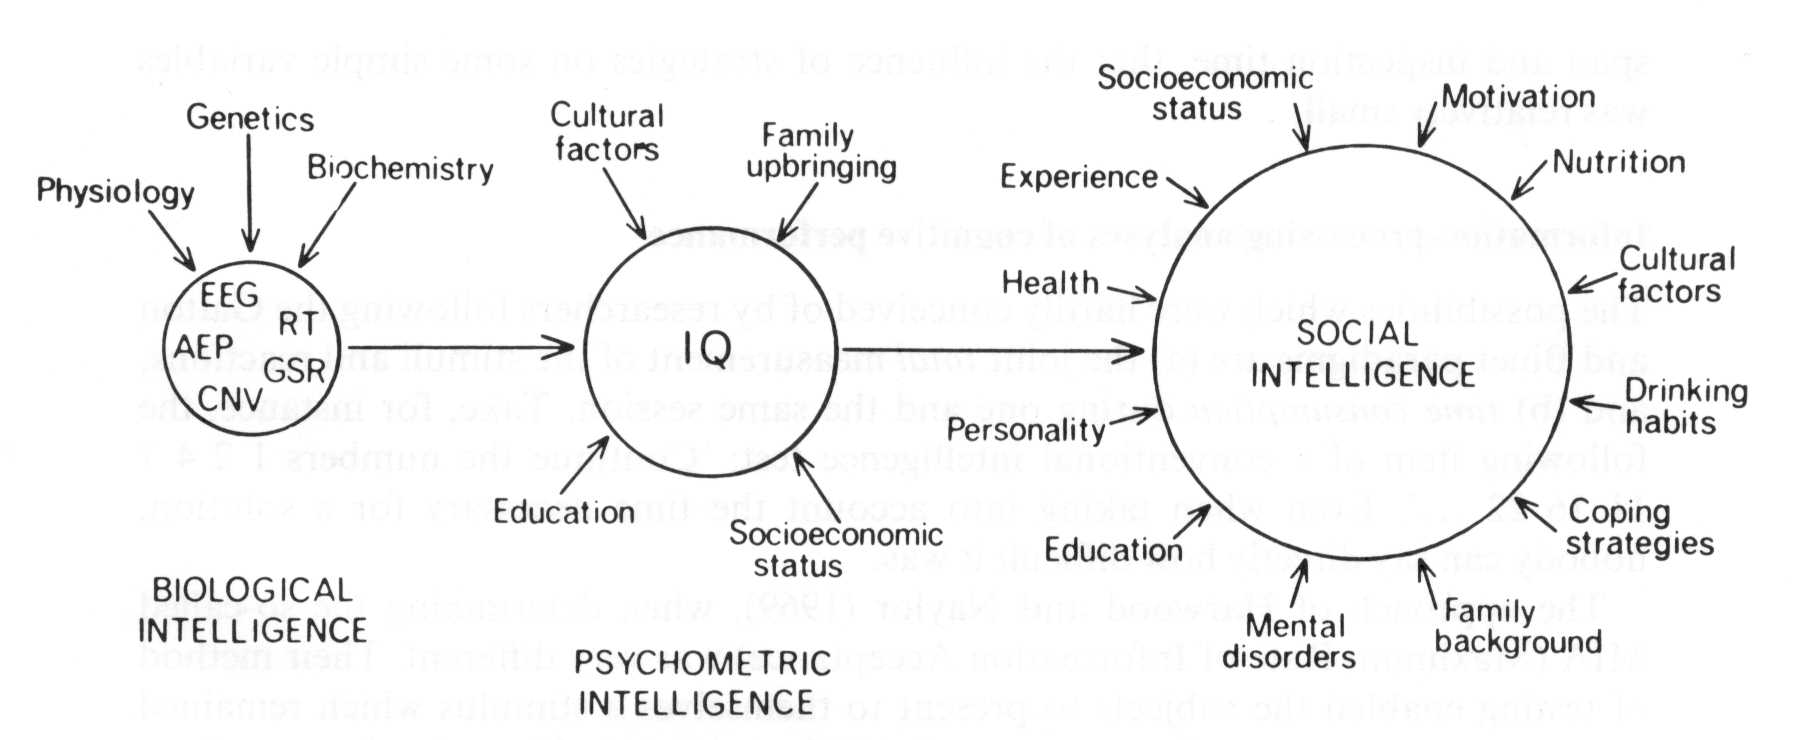
Intelligence cannot be claimed to depend on information processing on the basis of correlation coefficients alone. Such correlations merely indicate that performance on the different tasks of intelligence tests has something in common. It could be a complex pattern of strategies at a high cognitive level or, on the contrary, the effect of one simple variable, ubiquitously participating in all performances. The adherents of the Galton paradigm, as Eysenck (1983) called it, prefer the interpretation that a simple parameter speed of information processing determines or constitutes more complex mental
achievements. In this sense, mental speed is not only simple but also basic.
Besides, it is arguably more intimately connected with biological background
than the complex tests which depend essentially on experience (see Figure 1).
In
the Galton tradition, we find not only theoretical evidence, concurring from
simplicity and closeness to physiological concepts, but also empirical findings
promising to accumulate arguments in favour of the assumption that such
variables are not governed largely by a complex set of mental processes. Chase,
Lyon and Ericsson (1981) and Lyon (1977), as well as Egan (1986), indicated,
respectively for memory span and inspection time, that the influence of
strategies on some simple variables was relatively small.
Information-processing
analyses of cognitive performance
The possibilities which were hardly conceived
of by researchers following the Galton and Binet paradigms are (a) the joint total measurement of the stimuli and reactions, and (b) time consumption during one and the same session. Take, for
instance, the following item of a conventional intelligence test: ĎContinue the
numbers 1 2 4 7 11 16 22 Öí. Even when taking into
account the time necessary for a solution, nobody can say directly how difficult
it was.
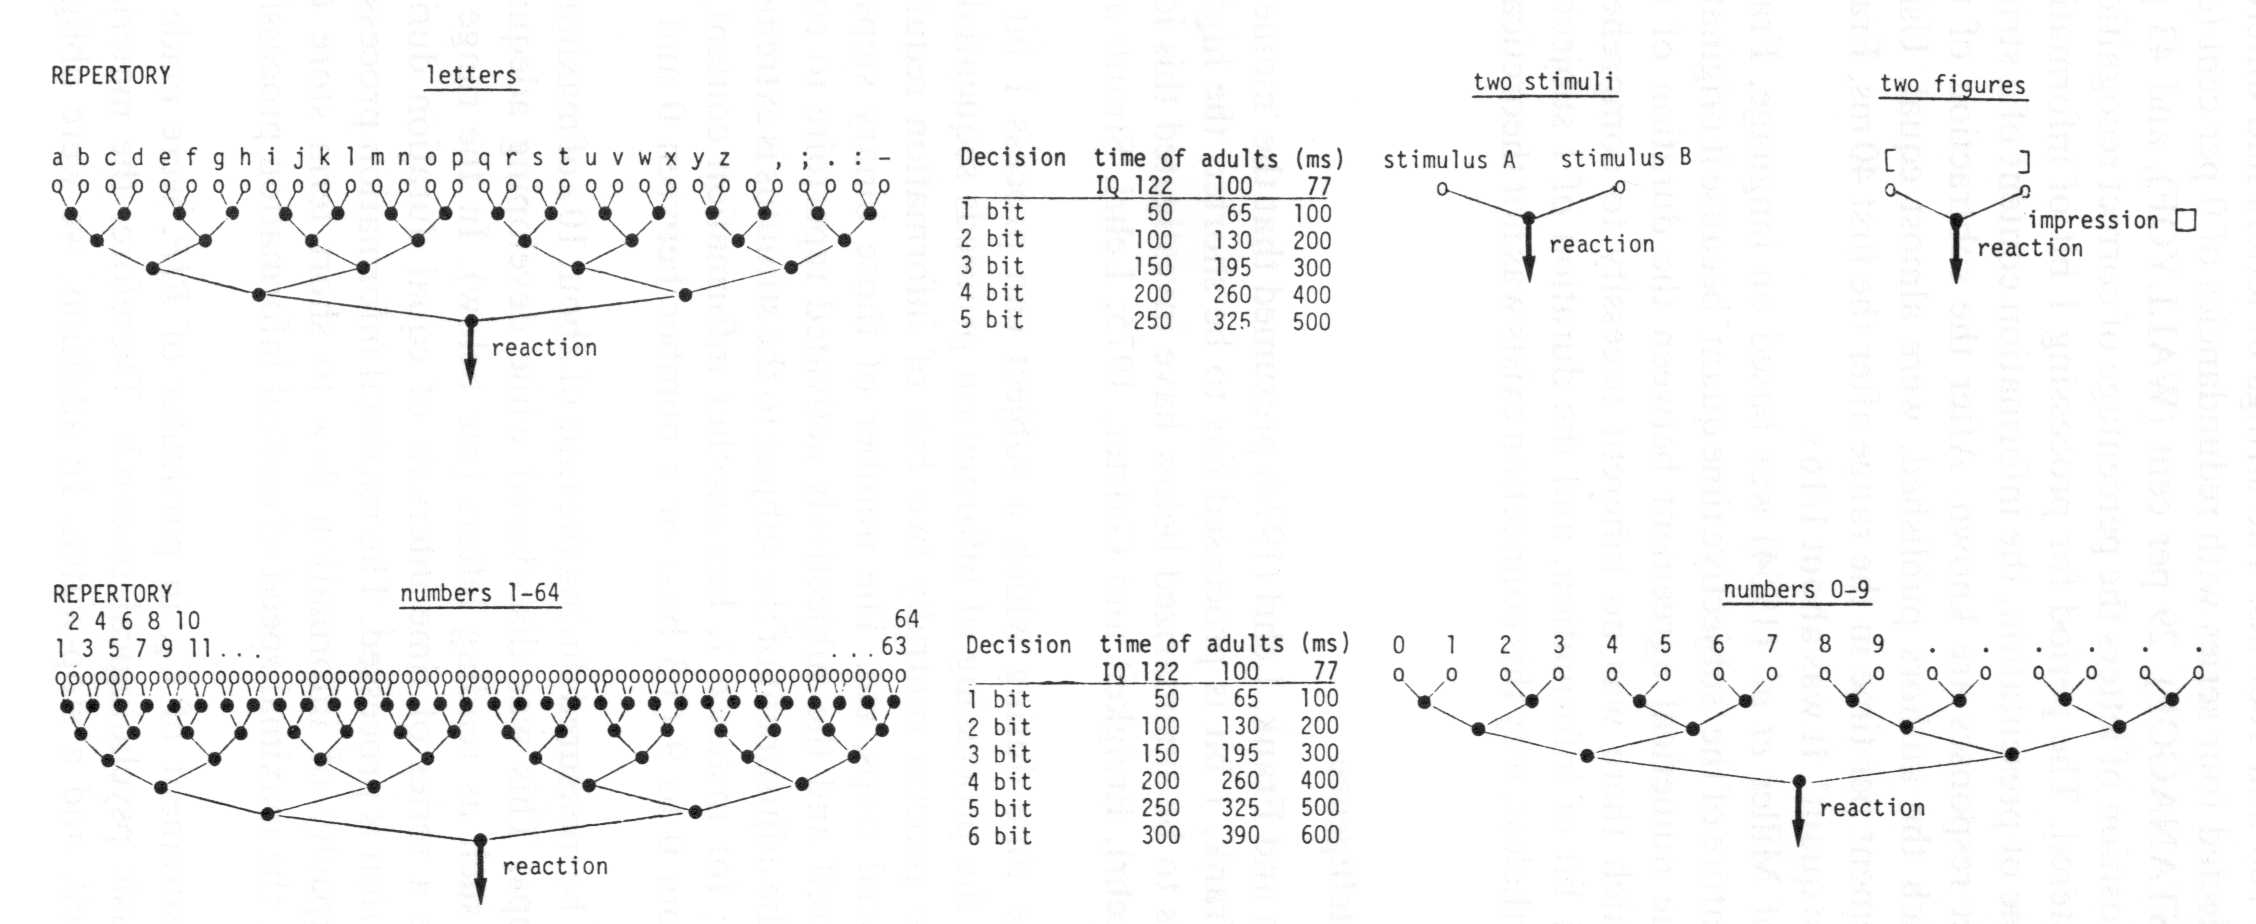
The
approach of Harwood and Naylor (1969), when determining the so-called MIA
(Maximum Rate of Information Acceptance) was very different. Their method of
testing enabled the subjects to present themselves a stimulus which remained as
long as they kept a finely balanced switch depressed. The stimuli were digits
between 1 and 9 or numbers between 1 and 32 presented singly or in groups of
two, three, four, or five. By the procedure the time was measured until the
signs were perceived by the subjects. The information content of one digit of
the repertoire of nine possibilities was 23.17 = 9. That is, 3.17
bits. To recognize one of the 32 possibilities (= 25) was equal to 5
bits.
††† The
MIA of 42 young university students (Naylor, 1968), was 21.4 bits per second (sd = 4.9 bit/s) referring to the
repertoire 1-32. The MIA for various adult groups was as follows: for 105
Ďnormalí adults who were 60-69 years old, mean = 14.2 bit/s (sd = 3.4bit/s); for 70-70 years old (N = 67),
mean = 12.9 bit/s (sd = 3.7 bit/s); and for the 13
subjects aged 80+, mean = 10.2 bit/s† (sd = 3.3
bit/s). With digits (repertoire 1-9) the means were similar (23.5, 15.2, 13.9,
and 11.7 bit/s, respectively).
Harwood and Naylor (1969) measured not only the time between stimulus
and reaction, but also the amount of stimulus information. This is the
precondition for the more striking observation that the results (in bit/s) are
numerically equal although the repertoires of signs differ.
†† The measurement of stimuli and reactions in terms of the information unit (the bit) and physical time will only reveal properties of the subject if the following two prerequisites are fulfilled: (a) the subject processes information in binary decisions, and (b) the information content of the objective repertoire agrees with that of the subjective repertoire. In the latter, the information is more precisely called ‘subjective information’. More generally expressed, the pedagogically oriented information psychology in
Germany uses the term Ďsubjective
informationí to emphasize the information content of a message from a subjectís
view. The more novel a message, or the further its distance from existing
knowledge, the greater is the subjective information it contains (e.g., Weltner, 1973). As Shands (1959)
stated, this seems to be true for both verbal and numeral information
processing.
††† When
a repertoire of signs (such as letters, digits, or numbers) is overlearned in normal adults, independently presented signs
Ė for example, the letters in the word Ďuenrd’ in contrast to ‘under’ – have the same objective as subjective information content. Otherwise, many of the experiments mentioned below could not have been successful. The MIA registered by Harwood and Naylor (1969) is in a certain way an example of a complete measurement, being composed of the following three essential parts: (1) stimulus: complexity by subjective information content, presentation time practically zero, and therefore negligible; (2) reaction: complexity (releasing the depressed switch) negligible compared with time of perception (in the case of more than two digits); and (3) time between stimulus and reaction (minus motoric reaction time), measured in ms.
††† The information amount being processed in a time unit seems to be constant, and independent of the specific information content of a given stimulus (= non-specific). This fact is confirmed by the almost equal absolute average MIA measured by stimuli of different repertoires. The correlations between MIA determined by numbers from 1 to 9 and MIA measured by numbers from 1 to 32 seem to sufficiently high if the high errors of the measurement of digits are taken into account [r(young adults) = 0.36; r(60-69 years old) = 0.68; r(70-79 years old) = 0.68].
Moreover, Harwood and Naylor (1969) conceived of MIA as a fundamental
capacity (in the sense of channel capacity) of cerebral data processing, which
forms the basis of more complex processes of perception and cognition.
Naylor and Harwoodís experiment was not designed to see whether measured
capacity is independent of stimulus mode (visual, auditory, tactile, kinaestethic, etc.). Lehrl and Fischer (see section
entitled ĎA general parameterí below), however, have demonstrated that
MIA-related magnitudes are general capabilities.
†††
Probably the key finding in the development of an intelligence theory from the information psychology of perception was the substantial correlation between MIA and intelligence test-scores in normal adults with an approximately representative distribution of IQ [WAIS-full scale: r(digits) = 0.46; r(numbers) = 0.47]. The highest correlations were found with the WAIS subtest ‘Digit symbols’, which is the best indicator of mental speed among all the WAIS subtests [r(digits) = 0.54; r(numbers) = 0.52]. (All correlations were significant
at the 0.01 level.) A further indicator of a relation with global IQ is the
high MIA of the group who consisted of young university students of presumably
high intelligence.
Finally, Harwood and Naylor (1969) emphasized the proximity of MIA to
biological variables: According to them, MIA assesses relatively accurately the
efficiency of Ďcerebral data processingí. What makes their results especially
valuable from the point of view of information psychology is that the data were
measured at the level of ratio scales. These features have many advantages for
the establishment of relatively simple theories of intelligence, and for
practical applications, as will be demonstrated below.
††† There is one fundamental denominator of all the characteristics of Harwood and Naylor’s (1969) that explains a great deal of the variance and also the correlations with global IQ. It is already contained in MIA. It is the duration of the basic period of central information processing (BIP).
THE INFORMATON PSYCHOLOGICAL PARAMETER ‘BIPí
Currently, there are several conceptualizations of the term speed of (central) information processing, and various corresponding lines of
theoretical development. However, here we will delineate the conceptualization
in the German-information psychology tradition that is rooted in biological
concepts.
The history of the
psychological moment: from biology to information psychology
More than a century ago the biologist Von Baer
(1864), who is famous as the discoverer of mammalian ova, had the idea that
different species in the animal kingdom could be ordered in terms of the speed
with which they process changing events. These internal speeds were based on
discontinuous psychical units of a certain length (moving like the single
frames of a film, as we would say today). He called these units Ďmomentsí and
presumed that human had six to ten per second, whereas snails of course had
distinctly fewer.
Wundt (1874), founder of the first psychological
laboratory, took up this idea and determined the human Ďmomentsí as having a
duration of 1/18 to 1/16 of a second. The biologists Von Uexküll
(1928) and Brecher (1932) confirmed these values and
claimed their independence of specific sensory modes. Some typical examples of
their observations were that 18 acoustic waves per second cannot be
distinguished but are heard as a single tone, 18 single pictures of a movie
give the impression of a continuous movement, and 18 pinches per second on the
same skin area are perceived like one uniform irritation. Similarly,
experiments with animals were conducted which led to relatively unequivocal
conclusions about their genus-specific moments. So, when snails were touched
one to three times per second by a stick, they suddenly moved back. But as soon
as they were touched for times or more per second they tried to creep on it,
presumably because they perceived it as a fixed object. Therefore, it was
concluded that their moments last 1/3 to 1/4 s.
By a
similar method, called Ďpicture fusioní, Riedel (1966) demonstrated that the
moment shortens as children mature. By this method, which is explained in the
next section, he investigated children from 7 years (10 moments/s) onward to 15 years (15 moments/s). This latter value is
consistent with those of average adults (Lehrl and Fischer, 1988).
A
simple measurement of the moment can be conducted by exchanging two pictures
like ĎIí and Ď<í. When increasing the frequency of changes to more than 16
per second, average adults form the impression of a ĎKí. Correspondingly, when
slowing down from a high change rate of more than 16 per second to about 14
changes per second the impression arises that there is not one sign but two
alternative signs. The mean of the increasing and decreasing procedure is to be
taken as characteristics for the moment. For his experiments with children,
Riedel used pictures such as two children on a seesaw in two positions (Picture
1: left child up, right down; Picture 2: the reverse). The children had to
report their impressions: moving seesaw or two unmoved seesaws forming a cross.
It is remarkable that critical flicker fusion (30-50 Hz) has nothing to do with
the picture fusion (mean = 15-16 Hz). Theoretically and empirically this was
demonstrated by Weidenhammer and Fischer (1985).
Their findings are affirmed by the fact that picture fusion is related to
intelligence, whereas, according to Jensenís (1983) results, critical flicker
fusion has virtually no correlation with intelligence.
Frank
(1959) noticed the numerical agreement between the duration of human moments
and the period in which 1 bit of information was processed. He called it the
Ďsubjective time quantí, and thought its duration in adult humans to be 1/16 s.
His concept was supported mainly by two information-theoretical analyses. The
first conclusion was drawn from Hickís (1952) experiments, particularly from
the slopes that were obtained when the reaction time was related to binary
information content. Frank calculated 1/16 s for the processing of 1 bit of
information, presuming that the decisions for the perception of the stimuli
were as many as for the reactions because the subjects had to recognize one of
a certain number of possible stimuli. In the next step, she/he had to out the
correct one of the same number of possible reactions.
The
second confirmation came from an experiment by Miller, Bruner and Postman
(1954), which was called Ďrecognizing letters for different redundancyí. At any
one time, they projected tachistoscopically groups of
eight letters. The time of presentation varied between several 100 and 1000 ms.
The strings of letters had different redundancies. The
authors selected four series with redundancies of 0 per cent (e.g. YRULPZOQ),
15 per cent (STANAGOP), 29 per cent (WALLYOF), and 43 per cent (RICANING). At
each position of letters the percentage of correct recognitions after a
presentation was registered. The period for processing 1 bit of information can
be calculated when the time of presentation, the information content of a
string, and the percentage of correct responses are known. After the
subtraction of the redundancies the curves, which the author published, were
almost equal. Using the slope of information increment per time in the range
after the first 40 ms, Frank determined the Ďsubjective time quantí. It was
about 1/16s.
Although the experiment of Miller et al. (1954) was based on language,
Frank never doubted the biological nature of the Ďsubjective time quantí
because it originated in physiological concepts. The numerical agreement
between the duration of the psychological moment, in which there was no
inherent necessity to comprehend it as the unit for processing 1 bit of
information, and the duration of 1 subjective time quant was striking.
Nevertheless, why this connection exists was not clear theoretically.
BIP, the basic
determinant of intelligence
Comparing the results of Roth and Frank, Lehrl
(1974) presumed that the Ďmomentí during which, according to Frank, 1 bit is
processed has to be shorter, the higher the IQ. Empirical investigations to be summarized below have investigated this
idea (Lehrl and Erzigkeit, 1976; Lehrl, Erzigkeit and Galster, 1975;
Lehrl, Straub and Straub, 1975).
Figure 2.†††
Models of information processing of different repertoires (‘letters’, ‘two stimuli’, ‘two figures’, ‘numbers 1-64’, and number 0-9’). The processes run in binary steps (measured in bits) from top to bottom. Therefore, it needs more decisions to process more extensive repertoires (e.g. letters contain 5 bits of perceptual decision until a reaction may be started) than less extensive ones, such as two stimuli (1 bit until the reaction is possible). On the magnitude that is connected with IQ in this way holds: The higher the IQ, the quicker the processing of 1 bit of information, and the shorter the reaction times.
BIP is the
shortest possible time during which a subject can process 1 bit of information.
In our account, the processing of information proceeds sequentially, step by
step. The necessity to process centrally two bits of information requires two
steps, three bits three serial steps, etc. The number of those binary steps is
determined by the stimulus itself and the subjectively activated repertoire to
cope with this stimulus. Therefore, the adjustment of the subject to the
stimulus is extremely important: The same number, for instance 7, has another information content, if the subject expects a digit
from 0 to 9 (3.3. bits) or a number between 0 and 31 (5 bits) (see Figure 2).
††† BIP, which is a capacity, can be measured during the time of about 10 s of maximum effort. The capacity drops. This was discovered while developing adequate measures for serial activities such as reading letters (see below). In the range of about 10 s, there seems to be a series of time intervals of equal duration during each of which 1 bit of information is processed. The maximal information processed during 1 s was called the ‘capacity of information flow to short term store Ckí (Frank, 1959):† in other words, the maximal speed of central
information processing during 1 s.
†† Our first tests for the measurement of Ck, in particular of BIP, were
made in a clinic with no funds for basic psychological research. Therefore, the
materials were restricted to paper, pencil, and a stop-watch. In addition, we
were obliged not to stress the patients, so the tests had to be short and
uncomplicated and be of some benefit to bedridden patients. Although under such
conditions we could not achieve as sensitive and precise a measure as under laboratory
conditions, the important point was to meet the criteria for an
information-psychological approach, as outlined above.
†† With this aim, two tasks (‘letter reading’ and ‘number reading’) were developed. Letter reading, which is described in the Appendix, consists of independent letters that can be read aloud or silently. In the latter, it is established that the subject’s sign for the beginning and the end is the raising and lowering of thumb. The time from the first to the last sound (or sign) is registered. This can be converted to BIP or Ck (see Appendix).
†††
First, we examined whether there were correlations with
intelligence.† This was investigated in
two small samples of adults whose IQs† (vocabulary tests) were distributed approximately normally (Lehrl et al., 1975). The one sample (N1 = 18; age 49.9 ± 10.1 years; 13 women, 5 men; IQ: 108.5 ± 12.0) was psychiatrically normal. The other sample (N2 = 34, age= 50.2 ± 11.0; 32 men, 2 women; IQ 97.6 ± 16.3) suffered from endogenous
depression. After adjusting for the influence of age, the BIP of N1
correlated with IQ† -0.72.
In N2 the correlation was Ė0.54.
††† These
findings were replicated in a more extensive study (Lehrl and Erzigkeit, 1976) with 66 psychiatrically normal adults [age: 39.3 ± 16.1 years; IQ(vocabulary test): 99.3 ± 16.1; r(BIP-IQ) = -0.70].
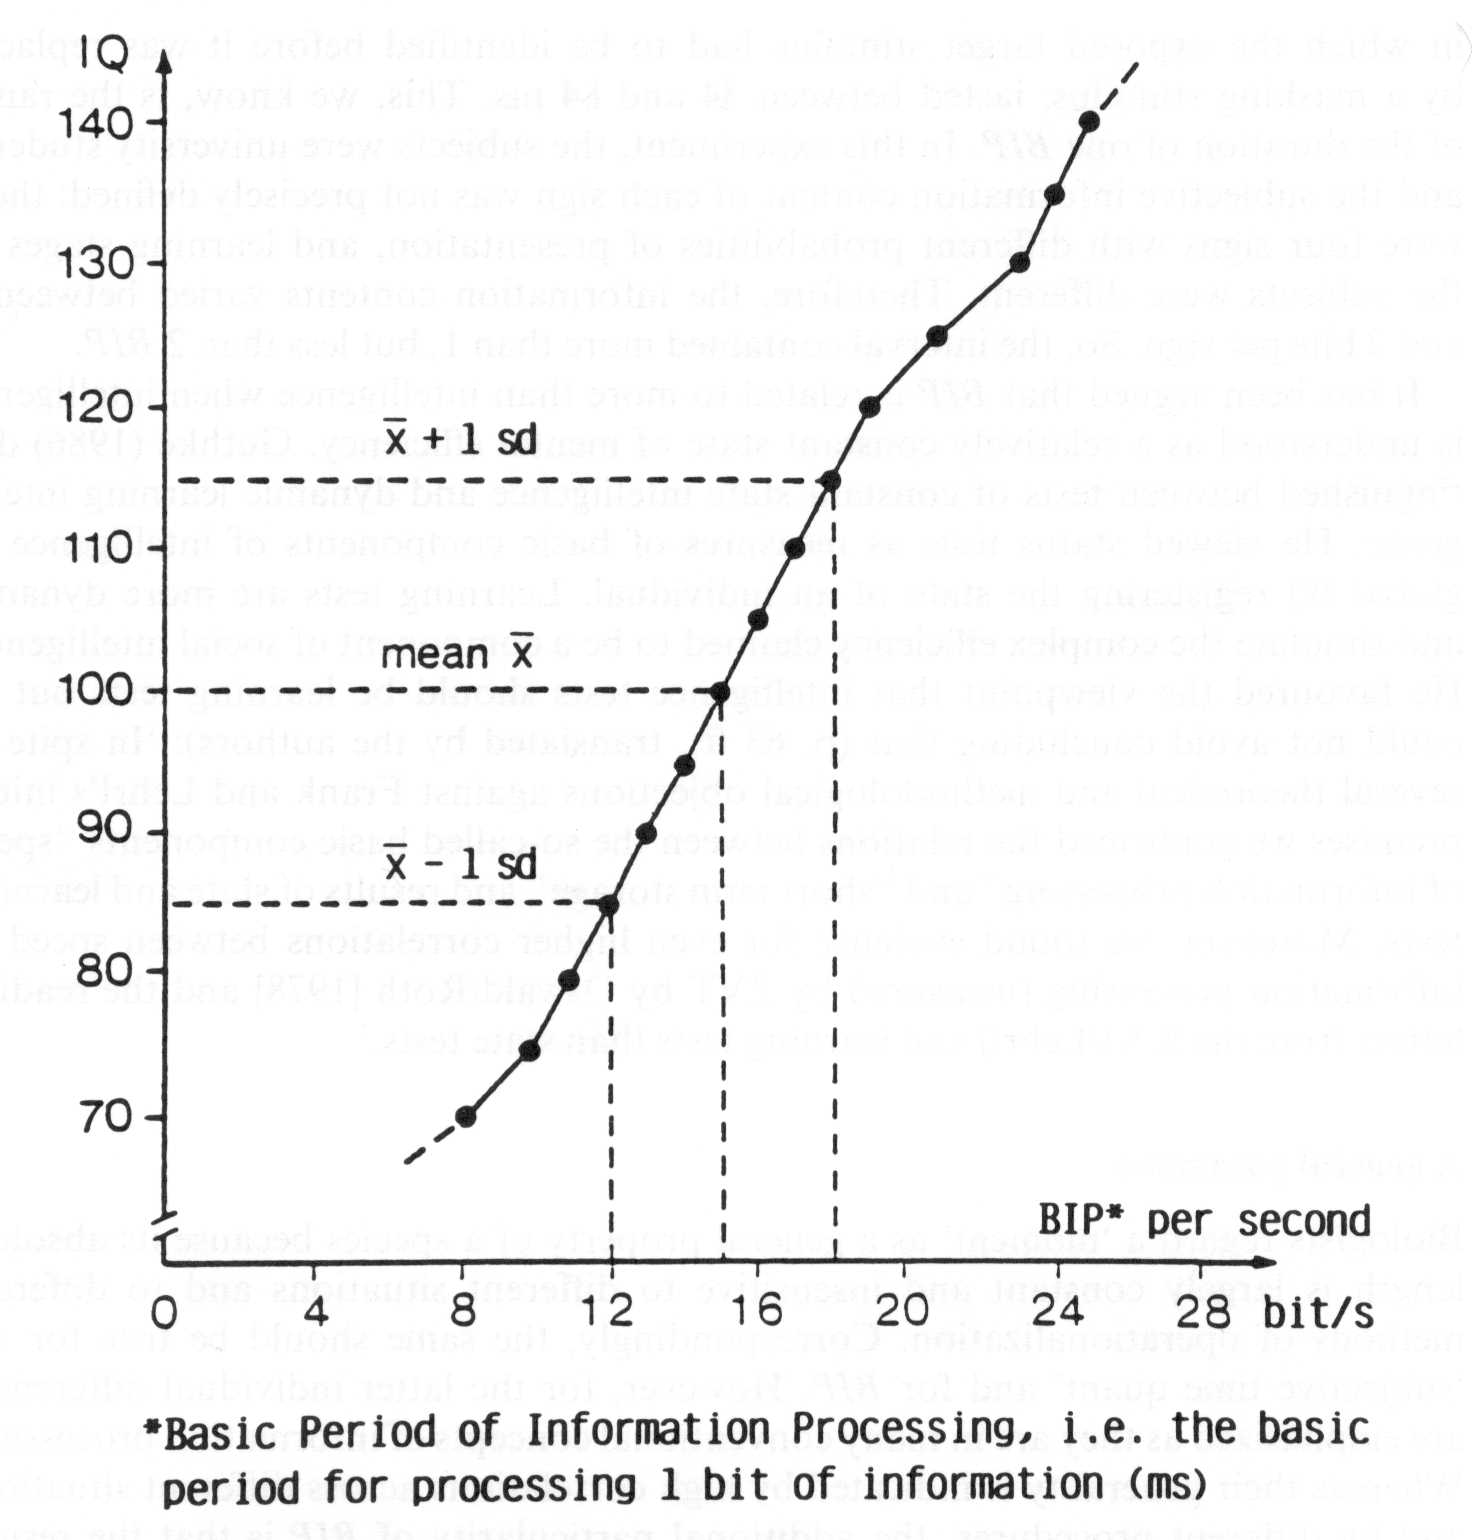
††† Thus, the relation with intelligence was confirmed (see Figures 2, 3, and 5). Meanwhile, more empirical studies have been conducted with different samples of psychiatrically normal adults with, in the large, representative IQs as measured by various tests. All such studies support a substantial r(BIP-IQ). A review of these studies carried out by
different research groups is presented by Lehrl, Gallwitz,
Blaha, and Fischer (1990) (Table 1). The magnitude of the correlation between BIP and intelligence is generally about Ė0.60.
|
Table 1.†††
All known studies on correlations between BIP, measured by Ďletter
readingí, and traditional intelligence tests†
†
|
|
|
Sample characteristics
|
|
|
|
|
|
IQ
|
Age
|
|
|
|
|
Test
|
mean
|
sd
|
mean
|
sd
|
N
total
|
N
female
|
r(BIP-)
|
|
MWT-B-IQa
MWT-A-IQb
MWT-A or MWT-B
CFTc
ZVTd
|
112.5
102.7
108.5
112.4
105.0
†
†99.3
120.6
112.4
105.0
|
17.3
14.5
12.0
21.8
16.2
16.1
18.6
21.8
16.2
|
37.1
40.1
46.9
55.1
59.2
39.3
28.0
55.1
59.2
|
18.9
13.5
10.1
†
7.2
†
6.6
16.1
12.0
†
7.2
†
6.6
|
341
†26
†18
†
39
†48
†66
105
†
†39
†
48
|
151
†
12
†
13
†
19
†
26
†
36
†
?
†
19
††
26
|
-0.57
-0.61
-0.72
-0.58
-0.60
-0.70
-0.29
-0.80
†
-0.51e
|
|
Note: For further details, see the test manual by Lehrl et al. (1990).
aMehrfachwahl-Wortschatz-Test
(Multiple-Choice Vocabulary Test, version B), serves the measurement of the
(crystallized) general IQ.
bParallel form of MWT-B, see a.
cCulture-fair-Intelligence test, for (fluid) general IQ.
dZahlen-Verbindungs-Test
(Trail-Making test), for (fluid) general IQ.
eA few of these subjects
possibly suffered from the beginning of an organic brain syndrome. The
remaining correlations are all based on psychiatrically normal subjects.
|
†††† We
have conducted far more studies of psychiatric patients than of normals, but these results are not presented here because
they depend on various additional conditions such as type and severeness of the disorder (Blaha, 1980). On the average, the correlations of BIP-IQ obtained with psychiatric
patients approach the level of those with normals
when the intelligence test is sensitive to acute psychical disorders. This is
not the case, for instance, with the vocabulary tests, which are mostly
insensitive to cerebral dysfunction. Vocabulary tests are therefore preferred
for estimation of Ďpremorbid’ IQ. The correlation between BIP and the results of such tests for Ďpremorbidí IQ with psychiatric patients is lower than with normals (Lehrl et al., 1990). Thus, we conclude that BIP
indicates the momentary global or general mental efficiency that is usually
estimated by global intelligence tests which are highly loaded with the general
factor in the Spearman sense.
†† It is worth mentioning that several of our studies were contrived to find connections between BIP and scores on tests which are variously related to intelligence (Table 2). The ten correlations between BIP and
these test scores ranged from 0.52 to 0.82.
|
Table 2.†††
Results of studies on correlations between BIP, measured by Ďletter readingí,
and tests for achievements which are variously related to intelligence
|
|
|
Sample characteristics
|
|
|
|
|
|
|
IQ
|
Age
|
|
|
|
|
|
Test
|
mean
|
sd
|
mean
|
Sd
|
|
N
total
|
N
female
|
r(BIP-)
|
|
Reading words
Reading digits
The same 10 min later
Saying opposites of read words (black ģ
white, low ģ high, etc.)
The same 10 min later
Counting symbols
Reading A for ĎBí and B for ĎAí
(interference)
|
108.5
†97.6
?
112.4
105.0
112.4
105.0
|
12.0
16.3
?
21.8
16.2
21.8
16.2
|
46.9
50.2
16 to
55.1
59.2
55.1
59.2
|
10.1
11.0
45
7.2
6.6
7.2
6.6
|
Normals
Depressives
Normals
Normals
Normals
Normals Normals
|
18
34
20
39
48
39
48
|
13
32
10
19
26
19
26
|
0.82
0.54
0.80
0.70
0.61
0.70
0.59
0.55
0.78
0.62
|
|
Note: Fur further details,see the test manual by
Lehrl et
al. (1990)
|
††† The backward-masked tasks used in many inspection time measurements give further support for a relationship between BIP and intelligence. The average correlations
across those studies between inspection time and IQ are substantial (Irwin,
1984; Longstreth et al., 1986). Even among university
students (having restricted variance in intelligence) reliable tachistoscopic estimates of inspection time have been
claimed to correlate at around Ė0.40 with IQ (WAIS-R) (Stough
and Nettelbeck, 1989). Furthermore, there are hints of an intimate relation between backward masking and BIP. In the
experiment of Longstreth et al. (1986), the efficient intervals, in which the exposed target stimuli had to be identified before it was replaced by a masking stimulus, lasted between 34 and 84 ms. This we know, is the range of the duration of one BIP. In this experiment, the subjects were university students and the subjective information content of each sign was not precisely defined: there were four signs with different probabilities of presentation, and learning stages of the subjects were different. Therefore, the information contents varied between 1 and 2 bits sign. So, the interval contained more than 1, but less than 2 BIP.
††† It has been argued that BIP is related to more than intelligence when
intelligence is understood as a relatively constant state of mental efficiency.
Guthke (1986) distinguished between tests of constant
state intelligence and dynamic learning intelligence. He viewed status tests as
measures of basic components of intelligence or global IQ registering the state
of an individual. Learning tests are more dynamic and simulate the complex
efficiency claimed to be a component of social intelligence. He favoured the
viewpoint that intelligence tests should be learning tests but he could not
avoid concluding that (p. 63 ff., translated by the authors): ĎIn spite of
several theoretical and methodological objections against Frank and Lehrlís initial premises we confirmed the relations between the so-called basic components “speed of information processing” and “short term storage” and results of state and learning tests. Moreover, we found evidence for even higher correlations between speed of information processing (measured by ZVT by Oswald/Roth [1978] and the reading letters from the
KAI/Lehrl) and learning tests than state tests.í
A general parameter
Biologists regard a Ďmomentí as a general
property of a species because its absolute length is largely constant and
insensitive to different situations and to different methods of operationalization. Correspondingly, the same should be true for the ‘subjective time quant’ and for BIP. However, for the latter individual differences are emphasized as they are in many conventional concepts of information processing. Whereas their generality is indicated by high correlations across different situations and by different procedures, the additional particularity of BIP is that the results of the same subjects should be numerically equal even when different methods are used. That is, a person who is characterized by a BIP of 67 ms by one method of measurement should achieve the same BIP when another procedure is used (allowing for
errors of measurement). This presupposes a constant level of motivation.
|
Table 3.†††
Comparison of results when Ck (bit/s) or BIP (ms)
are measured by signs of different physical appearance: letter reading of
capitals versus small letters
|
|
|
Sample characteristics
|
|
|
Reading letters
|
|
|
|
IQ
|
Age
|
|
|
Capitals
|
Smaller letters
|
|
|
|
mean
|
sd
|
mean
|
sd
|
N
total
|
N
female
|
mean
|
sd
|
mean
|
sd
|
r
|
|
Ck (bit/s)
†
Styrene exposed† workers
†
Non-exposed controlls
BIP (ms)
Outpatients
†† Brain syndrome
††
Questionable††††††††††††††††††††††††††
†††††brain syndrome
††
Without brain†† syndrome
|
95.0
98.8
94.7
105.0
112.4
|
10.9
10.2
12.2
16.2
21.8
|
39.3
38.1
63.9
59.2
55.1
|
10.1
10.3
7.9
6.6
7.2
|
36
19
54
48
39
|
†
0
†
0
22
26
19
|
15.3
15.9
15.9
16.2
131.8
117.2
100.8
|
2.3
2.4
3.0
2.8
60.8
81.3
81.2
|
15.0
15.2
16.1
16.6
134.2
118.3
103.7
|
2.2
2.4
2.3
2.8
63.0
85.0
92.8
|
0.84a
0.83b
0.87a
0.85b
0.94a
0.98a
0.99a
|
|
Note: For details and data and sources see Lehrl et al. (1990).
a Basic version of Ďletter readingí.
b Parallel version of Ďletter readingí.
|
††
Accordingly, we set out to test this prediction. The subtests of Ďletter
readingí were appropriate for such a study because two of the four lines were
written in small letters and the other two in capitals. The different physical
appearances should not exert an influence on the time of reading, or on CK, or on BIP. This was investigated in five samples of subjects, from which the best value of the two tests with capitals was compared with the best value of the remaining lines [see Table 3; details in Lehrl et al., (1990)]. As expected, different forms of stimuli did
not influence the results.
Figure 3. Relationship between the amount of BIP per second and IQ measured by
the multiple-choice vocabulary test MWT-B (N=672)
†††
Another study was more ambitious (Lehrl et al., 1975; Lehrl and Fischer, 1988).
In addition to capital and small letters, values from 0 to 9 (digits) and 0 to
99 (numbers) were presented. The information content for letters = 4.7 bits,
for digits = 3.3. bits, and for numbers (0-99) = 6.6 bits. Responses were both silent and aloud. An example of a line of numbers to be read was: 16 59 81 12 26 41 37 89 96 24. These different procedures were
administered to 27 physicians, psychologists, and postgraduates of the Erlangen University (FRG). The median values agreed well.
Capital letters aloud = 22 bit/s, silently = 22 bit/s, small letters aloud = 23
bit/s, silently = 23 bit/s, numbers (0-99) silently = 23 bit/s. The average
deviation of the individual values across different procedures was 4-5 per
cent, i.e. 1 bit/s, and there was no significant deviation. However, this study
has some limitations. Speaking numbers aloud usually takes longer than
perceiving numbers because they have several syllables. Therefore, the results
for reading numbers (0-99) aloud failed to reach the level of about 22 bit/s.
The same occurred with reading digits (0-9) silently and aloud. Our preliminary
explanation is: The digits extent of repertoire is so small (0-9) that the
apperception time is shorter than the time consumption of the reactions which
are performed in parallel, such as speaking the digit vocally or subvocally and turning to the next digit.
††
Another experiment for the investigation of the generality of BIP was
conducted using Ďfusion of picturesí, Ďletter readingí, and Ďstimulus reaction
timeí (specifically double stimulus minus simple stimulus reaction time). These
procedures were administered to 16 workers with lower IQs than the
above-mentioned scholars. As expected, their achievements were lower. The
medians were: Ďfusion of pictureí = 14 bit/s, Ďletter readingí = 14 bit/s, and Ďstimulus reaction timeí = 13 bit/s. The
correlations of Ďpicture fusioní with Ďletter readingí = 0.70, with Ďstimulus
reaction timeí = 0.69, and the latter with Ďletter readingí = 0.40. Considering
the restricted variance of the values and the high errors of measurement in all
of these procedures except Ďletter reading (see section on ĎFacilitating valid
measurementí below), these correlations are remarkable.
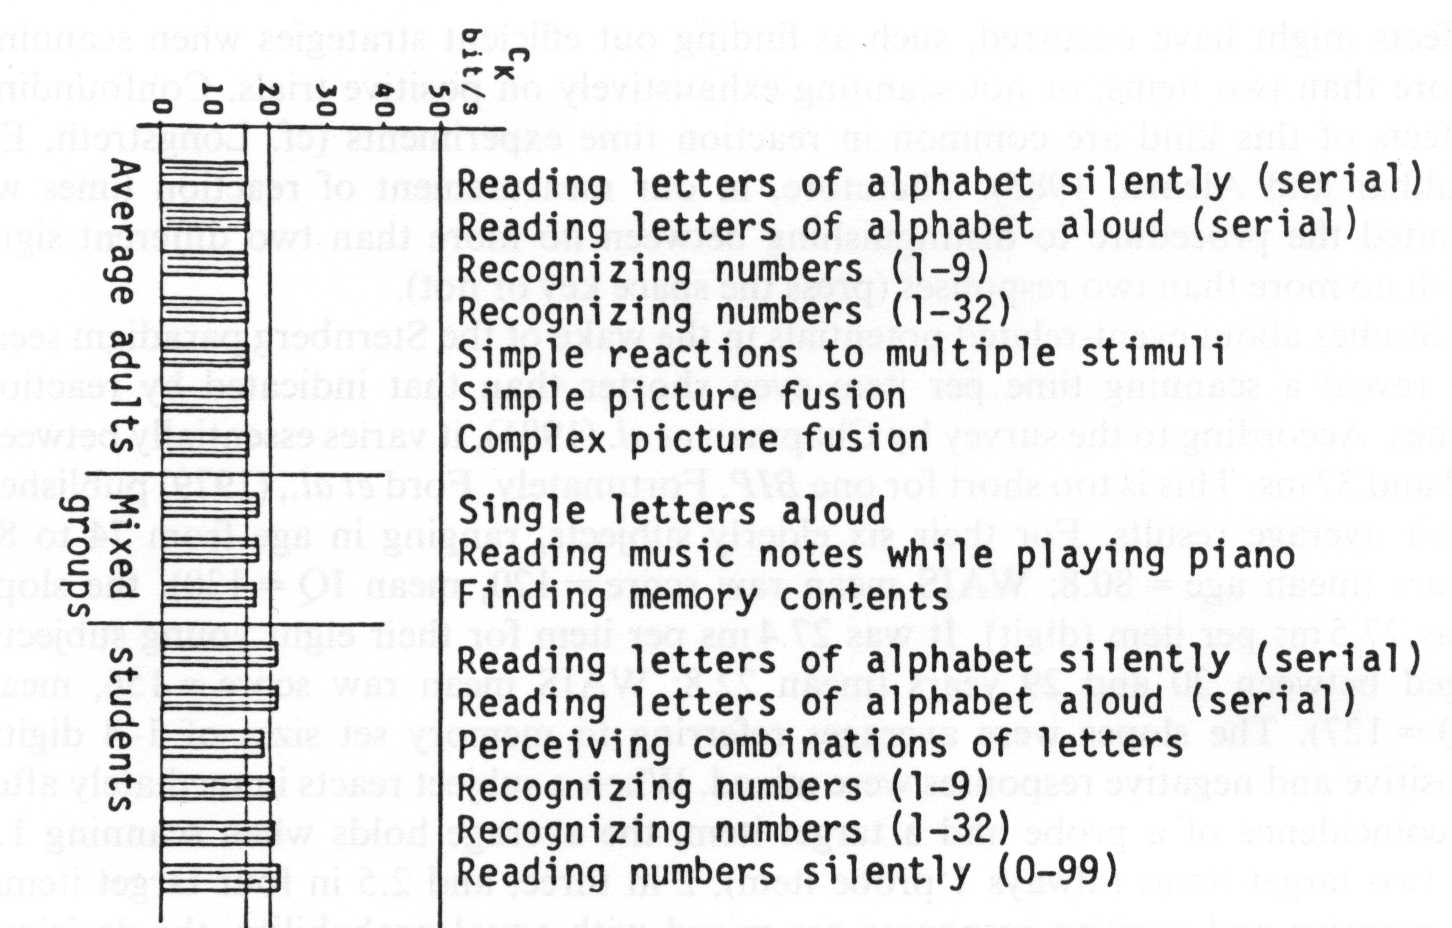
††† Now we discuss the results of additional studies that show approximate numerical agreements using further variables which are assumed to be an expression of BIP (or CK ). However, with the exception of Harwood and Naylor’s (1969) study, these demonstrations are not so convincing because their results concern only the mean of one variable for a certain sample of subjects. Thus, connections between different variables cannot be investigated. Moreover, IQ is often not reported, which is important for the level of BIP
measure.† As a guide for evaluating their
results, university students can be expected to have means of 18 bit/s and
more, samples with average education about 15 bit/s, and samples with lower
education less than 15 bit/s.
Harwood and Naylorís (1969) measurement of MIA agree with these
statements. In accord with this are estimations of the speed of information
processing in adding and multiplying digits by adults. Both the speeds are
about 14 bit/s (Lehrl and Fischer, 1988). Applying Ďrecognition of letters of
different redundancyí to education students, Frank and Wagner (1982) determined
MIA to be 18-19 bit/s.
Wenzel (1961) presented pianists independent musical notes out of a
repertoire of 17 possible notes. They were asked to play them as quickly as
possible. Wenzel registered the time required and calculated it to be 17.2
bit/s.
In
his well-known experiments, Sternberg (1966) presented his subjects with up to
two dozen signs from a repertoire. These signs were digits, letters or pictures
to be learned by heart. Later, he displayed one sign from the same repertoire
and subjects had to indicate as quickly as possible whether they had seen the
sign before, either by pressing a button or by responding verbally.
†††
Sternbergís experiments are comparable to those conducted by Oldfield (1966), who found a linear increment of reaction time [RT (ms)] with the information content (logarithm
dualis: ld) of the signs of a repertoire (M): RT (ms) = A + B x ld (M). A symbolizes the intercept and B is the increment of the reaction time when one sign is added to the repertory. This could be the BIP. In reanalyzing a study by Wingfield
(1965) who asked his subjects, mostly university students, to search in memory
for pictures previously learned, Oldfield obtained the function RT (ms) = 373 + 58 ld (M). Fifty-eight ms for one binary step of search
corresponds to 1000/58 ms = 17.2 bit/s. Briggs and Swanson (1969) conducted an
experiment confirming Oldfieldís results under the
precondition that the repertoire was overlearned.
††† Other
studies in the Sternberg paradigm, however, revealed an increment of reaction
times between 37 and 81 ms per scanning one item (e.g. Chapman, McCrary and
Chapman, 1981; Ford, Roth, Mohs, Hopkins and Kopell, 1979). Eighty-one ms was found in old adults [mean 80.8 years of age, Ford et al., (1979)] and could be a true value for 1 BIP for such
subjects. On the other hand, 37 ms seems to be too short, even for average
university students (cf. Table 5). Here confounding effects might have
occurred, such as finding out efficient strategies when scanning more than two
items, or not scanning exhaustively on positive trials. Confounding effects of
this kind are common in reaction time experiments (cf. Longstreth,
El-Zahhar and Alcorn, 1985). Therefore, in our
measurement of reaction times we limited the procedure to distinguishing
between more than two different signs with no more than two responses (press
the space key or not).
††
Studies about event-related potentials in the wake of the Sternberg
paradigm seem to reveal a scanning per item even shorter than that indicated by
reaction times. According to the survey by Chapman et al. (1981), it varies
essentially between 22 and 37 ms. This is too short for one BIP. Fortunately, Ford et al., (1979) published their average results. For their six elderly subjects, ranging in age from 74 to 84 years (mean age = 80.8; WAIS mean raw score = 120, mean IQ = 130), the slope was 27.5 ms per item (digit). It was 27.4 ms per item for their eight young subjects, aged between 20 and 29 years (mean 22.8; WAIS mean raw score = 156; mean IQ = 127). The slopes were averages referring to memory set sizes of 1-4 digits. Positive and negative responses were mixed. When a subject reacts immediately after a coincidence of a probe and a target item, the average holds when scanning 1.5 in two target items (always 1 probe item), 2 in three, and 2.5 in four target items. If negative and positive responses are mixed with equal probability, the decisions are 1 for one target item. An adequate correction would lead to a slope of 35.5 ms/item in the young and 36.6 ms/item in the old subjects. It still seems to be too short to meet the expectations for one BIP (Table 5). However, according to the diagram and the rule-of-thumb calculation, the curves of Ford et al., (1979) show that the slopes from the memory
set size of 1-2 target items are the highest Ė about 40 ms. The slopes from two
or three target items are zero or even slightly decreasing and to the end again
increasing, but less than form one to two target items.† After two target items, strategies seem to be
involved.† When taking into account the
positive responses, the slope for Ďelementaryí scanning amounts to 53.3 ms. This result meets the expectation for one BIP for
highly intelligent subjects (cf. Table 5).
Even
the control of one-dimensional manual movements towards a target maximally
approaches 16 bit/s, respectively 1 bit per 60 ms, as Stier
(1969) found in his experiments. The well-known findings by Fitts
(1954) and Annett, Colby and Kay (1958) on manual movements only resulted in
11bit/s. But Stier corrected their analyses and
obtained about 16 bit/s for these experiments.
††† By and large, the assumption is supported that BIP is a general parameter. That is, the calculated
values are independent of the extent of repertoire of stimuli or reactions, the
sense modes or motoric modes mediating the information, and the mode of sign (Figures 2 and 4). Furthermore, it me, Furthermore, it means that BIP, according to the
information-psychology position, determines the speed of apprehending
(apperception), associating (thinking), comparing, generating information, and
scanning from memory. Therefore, the time underlying these various components
of information processing is an indicator of the same underlying individual
capacity.
A parameter at a ratio or at an absolute scale level?
The measurement by the information unit ‘bit’ and the chronological unit ‘second’ opens the chance to measure BIP (in
particular Ck ) at metric levels. These units seem to model the
psychological processes adequately. The agreement of numerical results in bit/s
obtained in different ways supports the assumption that information is
processed in binary steps.
Figure 4.†††
Average values of mental speed expressed as Ck (= BIPs per second). Mean performance of three subject groups in different tasks and studies. (The mixed groups comprise a relatively high percentage of university students).
†
Moreover, in the measurement of both information units and reaction
times, an absolute zero point is given. These two conditions define a ratio
level scale. Since an individual is characterized by an absolute number (e.g.
18 bit/s), it is even on an absolute scale.
In
order to appreciate this advantage of BIP consider the following example. It would be legitimate
to claim that the Ck of a patient 3 h after a surgical operation
amounted to 60 per cent of his pre-operative value. In contrast, statements of
this kind are not correct for IQ, which is a parameter of frequency in a
reference group and not an individual measure.
††† The absolute point of zero also stresses that BIP is a basic parameter. Therefore, we argue that BIP determines intelligence and not the reverse. This position is supported by the biological nature of BIP as
indicated by the methods of its direct psychophysiological measurement by picture fusion or reaction time that was shown above. Subjects with a relatively long moment process little information per unit
time and therefore have many difficulties in solving problems in intelligence
tests (see Figure 5) or problems in daily life.
Facilitating valid
measurement
Because the parameter BIP is a
ratio measure, exact values count. A linear transformation of scores, which
would be acceptable in correlation studies of IQ, can therefore noticeably
distort the results. We have several suggestions for avoiding irregularities of
measurement.
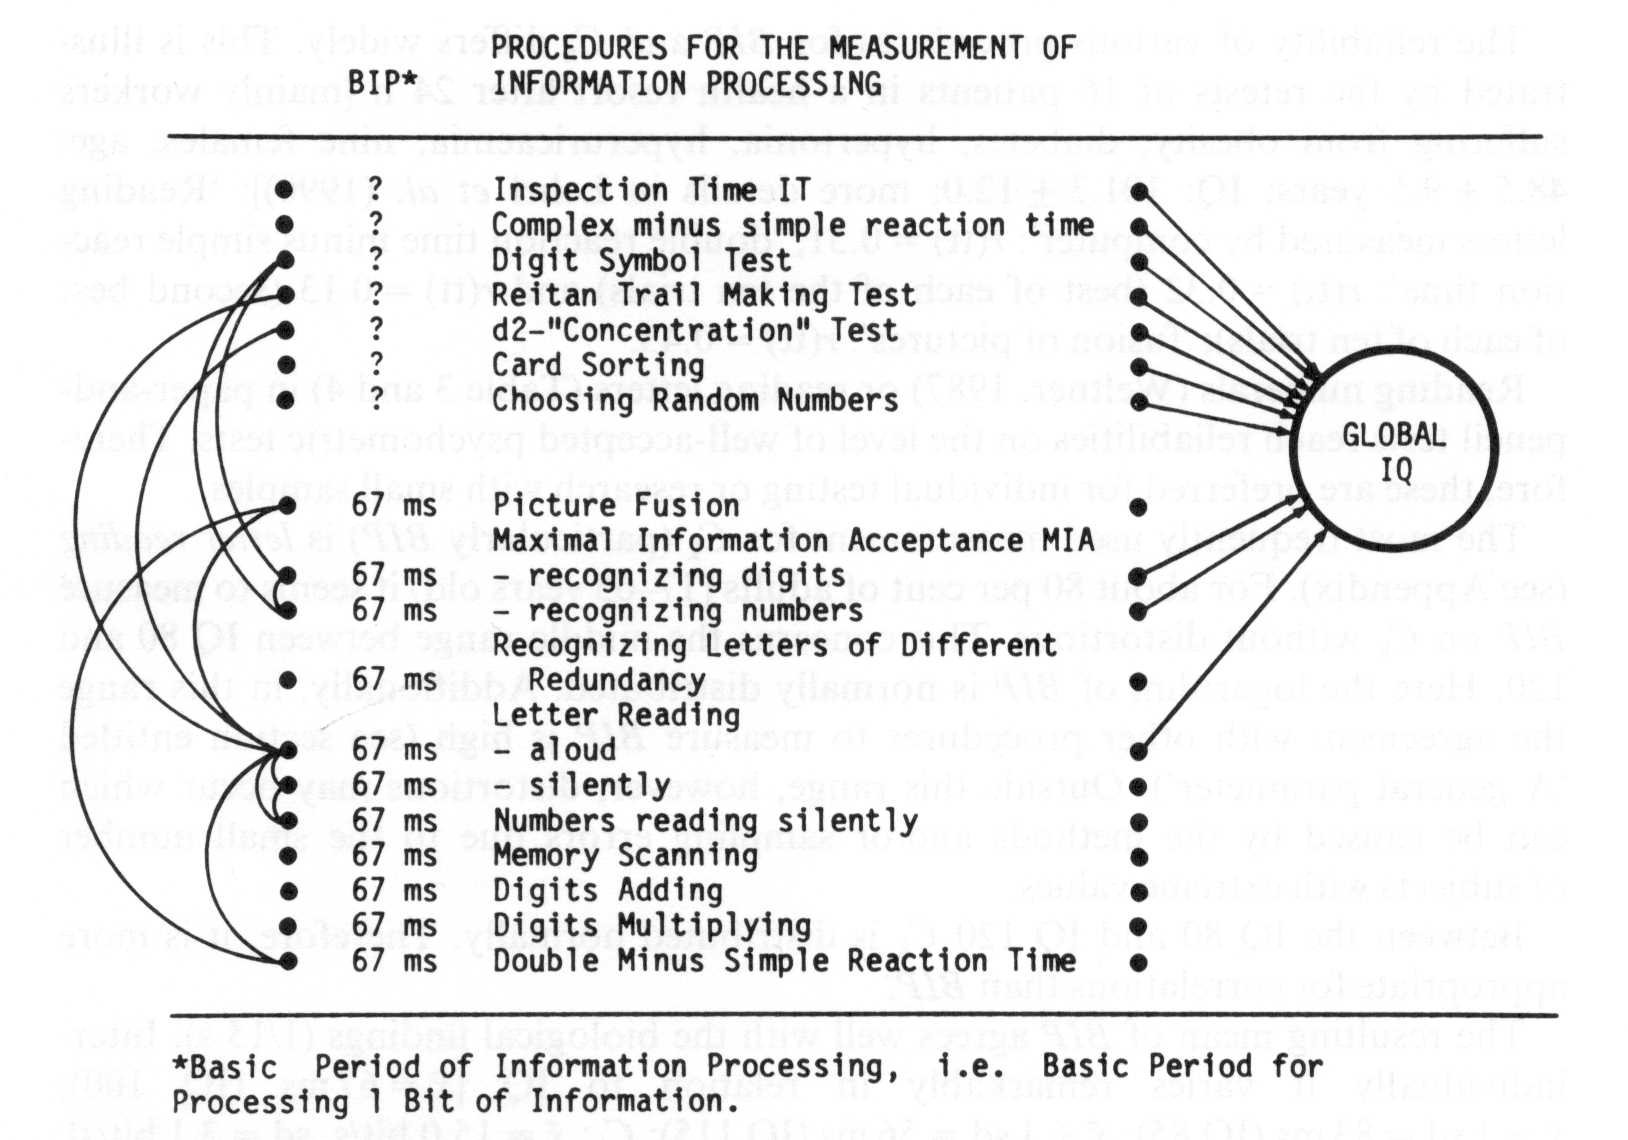
Figure 5.†
Subtest-neutral universality of duration of BIP and empirically confirmed correlations with global IQ. Drawn lines indicate already confirmed relationships. In contrast to traditional information processing tests (with question mark), the subtests recommended here allow BIP to be measured (mean 67 ms for IQ
100).
††† A general precondition for the measurement of the duration of BIP, as in
any other psychological efficiency test, is a well-motivated alert subject.
This has to be emphasized because, for instance, resting EEG parameters which
are registered in an atmosphere of relaxation are frequently compared with
results of psychological efficiency tests. In this case, a good correspondence
of electrophysiological and psychological variables cannot be expected.
Subjects should be familiar with the signs whose information has to be
processed. Signs that are overlearned are useful,
such as letters, numbers or geometrical figures (e.g. circles, crosses, and
dots). The same is true for the mode of response. The point is sometimes
ignored in stimulus reaction time studies.
The
subject has to be prepared for the repertoire of signs (e.g. ĎYou will see
digits between 0 and 9í, Ďnumbers between 0 and 99í, Ďlettersí). So that subjective
information content corresponds to objective information content. For example,
a number from the repertoire 0-9 has 3.3 bits (rounded of, 4 bits). However,
within the repertoire 0-99 the information content of the same number is 6.6
bits (rounded off, 7 bits).
When
evaluating the raw scores, the information content of the signs should be
rounded off because a subject can only perform full binary decisions.
Therefore, for one of the digits from 0 to 9 (3.3 bits), 4 full bits should be
taken.
††† The reliability of various procedures for BIP and Ck differs widely. This is illustrated by the retests of 16 patients in a health resort after 24 h [mainly workers suffering from
obesity, diabetes, hypertonia, hyperuricemia; nine females; age: 48.5 ± 9.5 years; IQ: 101.3 ± 12.0; more details in Lehrl et al. (1990)]: ‘Reading letters measured by computer’: r(tt) = 0.51; ‘double reaction time minus simple reaction time’: r(tt) = 0.32 (best of each of the ten trials)
and r(tt) = 0.13 (second best of each of ten trials); ‘fusion of pictures’: r(tt) = 0.43.
Reading numerals (Weltner, 1987) or reading
letters (Table 3 and 4) in paper-and-pencil tests reach reliabilities on the
level of well-accepted psychometric tests. Therefore, these are preferred for
individual testing or research with small samples.
††† The
most frequently used measurement for Ck (particularly BIP) is letter reading (see Appendix). For about 80 per cent of adults (17-65 years old) it seems to measure a BIP on Ck without distortions. This concerns the middle range between IQ 80 and 120. Here the logarithm of BIP is normally distributed. Additionally, in this range the agreement with other procedures to measure BIP is high (see section entitled ĎA general
parameterí). Outside this range, however, distortions may occur which can be
caused by the methods and/or sampling errors due to the small number of
subjects with extreme values.
††
Between the IQ 80 and the IQ 120 Ck is distributed
normally.† Therefore, it is more appropriate for correlations than BIP.
†† The resulting mean of BIP agrees well with the biological findings
(1/15s). Interindividually it varies remarkably in relation to IQ [mean = 67 ms (IQ 100); mean Ė 1 sd = 83 ms (IQ 85); mean + 1 sd =
56 ms (IQ 115)a; Ck = 15 bit/s, sd = 3.1 bit/s]. Depending on differences in
average IQ, there are also characteristic group differences of Ck (or BIP). So, the average value in adults is 15.bit/s
(sd = 3.1 bit/s), in medical
students 20.2. bit/s, and in the mentally retarded
about 9 bit/s or less.
There are several measures that are not adjusted to assess BIP or Ck without distortion because motoric components cannot be controlled. These include: (a)
the Reitan Trail Making test; (b) generating random
numbers by Lickliderís procedure described by Cherry
(1957), as well as Wagenaarís (1972) procedure; and
(c) all tests in which the repertoire of signs changes or refers to different
sense modalities. This last category includes one of the Naylor experiments
where a combination of numbers and letters had to be selected (Naylor, 1968),
and some experiments on complex stimulus reaction times (e.g. Ruchalla et al.,
1985).
†
FURTHER FEATURES OF BIP
†††
BIP is closely related to other
indicators of speed of information processing and therefore shares many of
their characteristics. For example, Oswald (1981) obtained correlations of
between 0.40 and 0.50 between speed of information processing and daily
activities, such as personal hygiene and going shopping, of elderly persons. In
the same way, many correlations between biochemical and neurophysiological parameters and speed of information processes or global intelligence obtained by Weiss (1984, 1986, 1987) and Eysenck (1979, 1986a, b) are also valid for BIP.
††
However, new features associated with BIP are even more important. Most of
them depend on measurement at a high metric level. As a consequence,
comparisons with other human metric parameters are possible.
Integration with
biological models of intelligence
Retests after minutes or months and even after
more than 1 year (Blaha, Pater and Lehrl, 1978; Lehrl et al., 1990) show that the maximum speed of
information processing remains relatively constant (see Table 4). Furthermore,
it varies substantially among individuals. Because units of measurement are
given, the coefficient of variation by Pearson (CV = 100 x mean/sd) can be assessed. CV of adults = 15 per cent (Lehrl and
Fischer, 1988).
|
Table 4.†††
Reliability coefficients of Ďletter readingí, basic version (if not
otherwise marked)
|
|
|
Sample characteristics
|
|
|
|
|
|
IQ
|
Age
|
|
|
|
|
Specific reliability
|
mean
|
sd
|
mean
|
sd
|
N
total
|
N
female
|
r(tt)
|
|
Split-halfa
Intercorrelation of the four Ďletter readingí
subtests
Retest
8 h later
Retest
14 days later
Retestf 14 months later
|
95.0
98.8
94.7
105.0
112.4
94.7
105.0
112.4
95.0
98.8
102.7
††††† ?
†††† ?
71.9
|
10.9
10.2
12.2
16.2
21.8
12.2
16.2
21.8
10.9
10.2
14.5
†††††† ?
†††††† ?
12.8
|
39.3
38.1
63.9
59.2
55.1
63.9
59.2
55.1
39.3
38.1
40.1
66.9
65.7
59.8
|
10.1
10.3
7.9
6.6
7.2
7.9
6.6
7.2
10.1
10.3
13.5
9.4
9.5
9.4
|
36
19
54
48
39
54
48
39
36
19
26
144
182
130
|
-
-
22
26
19
22
26
19
-
-
12
86
87
75
|
0.91
†0.86b
0.95
†0.86b
0.96
0.99
0.99
0.96-0.98c
†0.99c
†1.00c
0.86
0.88
0.62
0.94
†0.96e
0.89
†0.96e
0.70
|
|
Immediate retestd
|
100 female and male university
students
†between 18 and 28 years
|
0.81
|
|
Note: For detailed data and sources see Lehrl et al. (1990).
a r was calculated between the best of the first two cards and the best
of second two cards. Then, according to Spearman-Brown, the correction
formula was applied:
rí(tt) = 2 x
r(tt)
1 + r(tt)
b Parallel version of
Ďletter readingí.
c Calculated on the basis of the Spearman-Brown correction formula for
prolongation:
rí(tt) = 4 x
r(tt)
1 + 3x r(tt)
d r (original [German] version Ė Spanish version.
e
The values in the line above were taken on the 1st and 15th
days. This r(tt) refers to letter reading on the 15th
and 29th day, i.e. 14 days later (always basic version).
f r
(basic version Ė parallel
version).
|
Ck or BIP varies more than most biological parameters published by Wechsler (1935). To compare it: body length has a CV = 3-5 per cent and brain weight 8 per cent
(Lehrl and Fischer, 1988).
†††
Because BIP is arguably fundamental, biological counterparts can be suggested which reflect numerically comparable processes. In fact, Weiss (1986, 1987) refers to electrophysiological correlations of intelligence to account for the quantitative relations among basic parameters. He even considers the deeper microstructure of time events, and even regards BIP as a unit at a higher level. Although BIP seems to be the elementary unit to process centrally 1 bit of information, the lowest unit in the temporal architecture of mental processes may be the time-quantum T. Geissler (1987) proposed T as an almost universal constant lasting approximately 4.5 ms, in which case BIP †would always be an integer multiple of T. We will refrain here from further discussion of more differentiated models of BIP. The combined biophysical, physiological and
information psychological conceptions, however, appear to be suitable ways to
give a new foundation for the psychology of intelligence.
†††
Experiments with biological and information-psychological parameters
registered simultaneously from the same subjects will play an important role in
the development of these efforts. Neurophysiological variables, such as evoked potentials, are often used without due consideration of the information content of the stimuli, the alertness and motivation of the subjects, and the beginning of central processes at about 100 ms corresponding to BIP . Lehrl (1980) expects the basic rate of
processing 1 bit in averaged evoked potentials to be in the wave after P1
(postcentral: Wernickeís area and neighbourhood, speech-dominant hemisphere). The reasons are that (a) the latency time between P1 and P2 is the first interval to correlate with global IQ; (b) it corresponds numerically well with 1 BIP; and (c)
the simple stimulus reaction time amounts to about 250 ms (minus about 60 ms
for the basic decision stimulus yes-no = 190 ms, divided by 2; that is ca. 95
ms for the afferent and 95 ms for the efferent branch.)
Integration with
information content of the environment
There is still another important advantage to knowing
the individualís basic capacities for information processing. On the basis of
this knowledge it can be assessed whether and how an individual can master the
informational aspects of his/her environment. In principle, the assessment
succeeds if the informational content and the time of presentation of the
messages to be processed are registered. There are several approaches to
measure such messages that are understood to be sections of the informational
aspects of the human environment. The measurements mainly refer to speech and
book reading (Weltner, 1973). For instance, by
determination of an individualís capability of information processing and the
information content of a text the necessary time for reading can be predicted.
So, for example, an average adult patient (Ck maximally 15-16 bit/s)
needs for apperception of each word of drug instructions about 1 s because
empirical investigations have shown that the subjective content of each word of
average drug instructions amounts to about 16 bits. Because such instructions
comprise 600-1000 words, the patient will need 10-17 min for reading only and
this without deeper understanding.
††† In
contrast to IQ, which is a parameter solely referring to performances of a
subject relative to other subjects, the basic cognitive parameters of an
individual, presented here, facilitate quantitative
predictions of the individualís dependence on the information content of the
environment. Moreover, quantitative (i.e. metric) models of complicated
cognitive parameters and processes can be built on the basis of the parameters
presented here. This is particularly important because our society is changing
to an information society in which humansí relatively low capability to process
information is being severely taxed. Therefore, Cobarg (1986) argues for a psychologically founded system of strategies to cope with the affluent information, which he calls information hygiene. Mastering the affluent information
technically requires more knowledge of psychological moments and the
information content of the environment.
FURTHER ELEMENTARY COMPONENTS NECESSARY AND POSSIBLE
BIP correlates with global IQ approximately r = - 0.60. This relation seems to be strong because correlations of
global IQ tests such as the WAIS and Raven test are not much higher: mean =
0.65-0.75 (Wolfram, Neumann and Wieczorek,
1986).† But here the global IQ was
measured by a vocabulary test, which favours verbal, i.e. sequential, binary
processes. These, however, organize simultaneously presented information, which
is typical for spatial tests such as the Raven test (Das,
Kirby and Jarman, 1975). So, they improve the
efficiency to master these tasks remarkably. This was shown by Merz (1969) who asked students to verbalize when attempting to solve Raven test tasks. By this approach, their IQ improved 15 points. BIP is the basis unit of analytic and sequential information processing, which seems to be particularly intimately involved in concepts of intelligence. It is still unclear to what degree BIP has to be supplemented by parameters of
simultaneous and analogous processes in an attempt to reconstruct conventional
concepts of intelligence efficiently.
††† There is another basic parameter of intelligence and supplement of BIP, which has its own and relatively long history. It is the memory span (or immediate memory, span of apprehension, duration of presence). As two empirical investigations show, BIP and memory span together cover more of global intelligence than does each of them alone. In the one case, r = --0.80 instead of r(BIP -IQ) = -0.70 (N = 66) (Lehrl et al., 1975); in the other, r = -0.67 instead of –0.57 (N = 341)
(Lehrl et al., 1990).
†† After
accounting for the errors of measurement of each of the correlated variables,
only little residual variance is left over to cover additional aspects of
IQ.† The question is whether there are any more components to consider for the reconstruction of intelligence. Although for many practical purposes one or two elementary variables may suffice to represent global intelligence, for more complete functional models more variables need to be taken into account. Examples are the flexibility in shifting from one repertoire to signs to another, or control of information processes, or persistence. Unfortunately, these variables can only be measured on a lower scale level than BIP. We can only hope that new ways will be found
for measuring such additional variables on a high quantitative level, too.
†† Much research still needs to be done on the information psychological concept of intelligence presented here. Referring to BIP in particular, the concept and
findings may appear too simple in view of the sometimes strikingly inconsistent
results (e.g. concerning slope in reaction time studies or slopes in the
Sternberg paradigm). We need to enquire whether investigations outside of the
information psychological tradition have been designed with the necessary
preconditions. However, the results on the basis parameters of information
processing demonstrate the possibility of reconstructing the complex and
sometimes fuzzy traditional concept of intelligence by means of relatively
simple, general, easily measurable and precisely-defined basis variables, which
seem to be adequate for an integration with biological
models.
ACKNOWLEDGEMENTS
We would like to thank Dr. C. Brand (UK), Dr.
V. Weiss (GDR), Dr. S. E. Hampson (USA), and several
anonymous reviewers for their comments on earlier drafts of this paper.
REFERENCES
Annett, J., Colby, C. W. and Kay, H. (1958):
The measurement of elements in an assembly task Ė the information output
of††† the human motor system. Quarterly Journal of Experimental Psychology 10: 1-11.
Blaha, L. (1980): Information psychological procedures of measurement within psychiatry. In: Proceedings of the 9th International Congress on Cybernetics,
Namur: Association de Cybernetique,
pp. 519-527.
Blaha,
L., Pater, W. and Lehrl, S. (1978): Neue empirische Untersuchungen zur
Zuverlšssigkeit und GŁltigkeit von MeŖverfahren des Kurzspeichers als
Intelligenzkorrelat. Grundlagenstudien der Kybernetik und Geisteswissenschaften 19: 11-18.
Brand, C. R. (1984): Intelligence and inspection time: an ontogenetic relationship? In: Turner, C. H. (Ed.), The Biology of Human Intelligence.
North Humberside: Natterton,
pp. 53-64.
Brecher, G. A. (1932): Die
Entstehung und biologische Bedeutung der subjektiven Zeiteinheit Ė des Moments.
Zeitschrift für vergleichende Physiologie
18: 204-234.
Briggs, G. E. and Swanson, J. M. (1969): Retrieval time as a function of memory ensemble size. Quarterly Journal of Experimental Psychology 21: 185-191.
Carena, J. C. (1985): Adaptigo
de la inteligentectesto KAI al la hispana lingvoregiono.
Grundlagenstudien der Kybernetik und Geisteswissenschaften/Humankybernetik 26: 61-64.
Carlson, J. S. and Jensen, C. M. (1982): Reaction time, movement time, and intelligence: a replication and extension. Intelligence
6: 265-274.
Chapman, R. M., McCrary, J. W. and Chapman, J. A. (1981): Memory processes and evoked potentials. Canadian Journal of Psychology 35:
201-212.
Chase, W. G., Lyon, D. R. and Ericsson, K. A.
(1981): Individual differences in memory span. In: Friedman, M. P., Das, J. P. and O’Connor, N. (Eds.), Intelligence and Learning.
New York: Plenum, pp. 29-42.
Cherry, C. E. (1957): On Human Communication.
2nd ed., Cambridge, MA: MIT Press.
Cobarg,
C. C. (1986): Informationshygiene Ė Kritische Gedanken zur wachsenden
Medienwelt. Geriatrics Pregeriatrics – Rehabilitation 2: 119-132.
Cohn, S. J., Carlton, J. A. S. and Jensen, A. R. (1985): Speed of information processing in academically gifted youth. Personality and individual Differences 6: 621-629.
Das, J. P., Kirby, J. and Jarman, R. F. (1975): Simultaneous and successive syntheses: an alternative model for cognitive abilities. Psychological Bulletin 82: 87-103.
Dieminger,
H. (1988): Abhšngigkeit der Kreativitštsleistungen erwachsener Patienten von
deren Affektivitštsniveau, Intelligenzquotient, Alter und Geschlecht. Diss.,
Universitšt Erlangen.
Donders, F. C. (1868): Die
Schnelligkeit psychischer Prozesse. Archiv für Anatomie, Physiologie, wissenschaftliche Medizin 6: 657-681.
Egan, V. (1986): Intelligence and inspection time: do high-IQ subjects use cognitive strategies? Personality and individual Differences 7: 695-700.
Eysenck, H. J. (1967): Intelligence assessment: a theoretical and experimental approach. British Journal of Educational Psychology 37: 81-98.
Eysenck, H. J. (1979): The Structure and Measurement of Intelligence. Berlin: Springer.
Eysenck, H. J. (1983): A measure of intelligence. New Scientist 10: 668-669.
Eysenck, H. J. (1986a): Toward a new model of intelligence. Personality and individual Differences 7: 731-736.
Eysenck, H. J. (1986b): The theory of intelligence and the psychophysiology of cognition. In: Sternberg, R. J. (Ed.), Advances in the Psychology of Human Intelligence, Vol. 3. Hillsdale, NJ: Erlbaum,
pp. 1-34.
Fitts, P. M. (1954). The
information capacity of the human motor system in controlling the amplitude of
movement. Journal of Experimental Psychology 47: 381-391.
Ford, J. M., Roth, W. T., Mohs,
R. C., Hopkins, W. F. III and Kopell, B. S. (1979): Event-related potentials recorded from young and old adults during a memory retrieval task. Electroencephalography and Clinical Neurophysiology 47:
450-459.
Frank, H. G. (1959): Informationsästhetik – Grundlagenprobleme und erste Anwendungen auf die Mime pure. Waiblingen.
Frank, H. G. und Wagner, H.
(1982): Messung der Apperzeptionsgeschwindigkeit mit einem Experimentalfilm. Grundlagenstudien der Kybernetik und Geisteswissenschaften/Humankybernetik 23: 73-79.
Galton, F. (1892): Hereditary Genius: An Inquiry into its Laws and Consequences. London: Macmillan 1892.
Geissler, H.-G. (1987): The temporal architecture of central processing: evidence for a tentative time-quantum model.
Psychological Research 49: 99-106.
Grice, G. R. (1955): Discrimination reaction time as a function of anxiety and intelligence.
Journal of Abnormal and Social Psychology 50: 71-74.
Guthke,
J. (1986): Grundlagenpsychologische
Intelligenzforschung und Lerntestkonzept. In: Schaarschmidt,
U., Berg, M. and Hänsgen, K.-D. (Eds.), Diagnostik geistiger Leistungen. Berlin:
Deutscher Verlag der Wissenschaften, pp. 53-66.
Harwood, E. and Naylor, G. F. K. (1969): Rates and information transfer in elderly subjects. Australian Journal of Psychology 2:
127-136.
Hick, W. (1952): On the rate of gain of information. Quarterly Journal of Experimental Psychology 4: 11-26.
Irwin, R. J. (1984): Inspection time and its relation to intelligence. Intelligence 8: 47-65.
Jenkinson, J. C. (1983): Is speed of information processing related to fluid or to crystallized intelligence. Intelligence
7: 91-106.
Jensen, A. R. (1983): Critical flicker frequency and intelligence.
Intelligence 7: 217-225.
Jeske,
H., Lehrl, S. and Frank, H. (1982): āFaustformelní zum
IQ. Grundlagenstudien der Kybernetik und Geisteswissenschaften/Humankybernetik 23: 23-27.
Lally, M. and Nettelbeck, J. (1977): Intelligence, reaction time and inspection time. American Journal of Mental Deficiency 82: 273-281.
Lehrl, S. (1974): Subjektives
Zeitquant und Intelligenz. Grundlagenstudien der Kybernetik und Geisteswissenschaften 15: 91-96.
Lehrl, S. (1980): Subjektives
Zeitquant als missing link zwischen
Intelligenzpsychologie und Neurophysiologie. Grundlagenstudien der Kybernetik und Geisteswissenschaften 21: 107-116.
Lehrl, S. and Erzigkeit, H. (1976): Determiniert der Kurzspeicher das
allgemeine Intelligenzniveau? Grundlagenstudien der Kybernetik und Geisteswissenschaften 17: 109-119.
Lehrl, S. and Fischer, B. (1988): The basic parameters of human information processing. Personality and individual Differences 9: 883-896.
Lehrl, S., Erzigkeit,
H. and Galster, J. V. (1975): Messungen der
Apperzeptionsgeschwindigkeit auf dem Absolutskalenniveau. Eine experimentelle
Untersuchung. Grundlagenstudien der Kybernetik und Geisteswissenschaften 15: 1-11.
Lehrl, S., Gallwitz,
A., Blaha, L. and Fischer, B. (1990): GrundgrŲŖen der
Intelligenz. Kurztest KAI und seine Grundlagen. Ebersberg: Vless
1990.
Lehrl, S., Straub, B. and
Straub, R. (1975): Informationspsychologische Elementarbausteine der
Intelligenz. Grundlagenstudien der Kybernetik und Geisteswissenschaften 16: 41-50.
Leonard, J. A. and Carpenter, A. (1964): On the correlation between a serial choice reaction task and subsequent achievement at typewriting. Ergonomics 7: 197-204.
Longstreth, L. E., El-Zahhar, N. and Alcorn, M. B. (1985): Exception to Hick’s law: explorations with a response duration measure. Journal of Experimental Psychology: General 114:
417-434.
Longstreth, L. E., Walsh, D. A., Alcorn, M.
B., Szeszulski, P. A. and Manis, F. R. (1986): Backward masking, IQ, SAT and reaction time: interrelationship and theory. Personality and individual Differences 7: 643-651.
Lyon, D. R. (1977): Individual differences in immediate serial recall: a matter of mnemonics?
Cognitive Psychology 9: 403-411.
Merkel, J. (1885): Die
zeitlichen Verhšltnisse der Willensthätigkeit. Philosophische Studien 2: 73-121.
Merz, F. (1969): Der EinfluŖ
des Verbalisierens auf die Leistung bei Intelligenzaufgaben. Zeitschrift für experimentelle und angewandte Psychologie 16: 114-137.
Miller, G. A., Bruner, J. S. and Postman, L.
(1954): Familiarity of letter sequences and tachistoscopic identification. Journal of General Psychology 50: 129-139.
Naylor, G. F. K. (1968): Perception times and rates as a function of the qualitative and quantitative structure of the stimulus. Australian Journal of Psychology 20: 165-172.
Nettelbeck, T. (1987): Inspection time and intelligence. In: Vernon, P. A. (Ed.), Speed of Information Processing and Intelligence. Norwood, NY: Ablex, pp. 295-356.
Oldfield, R. C. (1966): Things, words and the brain. Quarterly Journal of Experimental Psychology 18: 340-353.
Oswald, W. D. (1971): ‹ber
Zusammenhšnge zwischen Informationsverarbeitungsgeschwindigkeit, Alter und
Intelligenzstruktur beim Kartensortieren. Psychologische Rundschau 22: 197-202.
Oswald, W. D. (1981): Das
NŁrnberger Alters-Inventar NAI als psychometrische Methode der klinischen
Pharmakologie. In: Platt, D. (Ed.), Funktionsstörungen des Gehirns im Alter. Stuttgart: Schattauer, pp.
129-136.
Oswald, W. D. and Roth, E.
(1978): Der Zahlenverbindungs-Test (ZVT). Handanweisung. GŲttingen: Hogrefe.
Reitan, R. M. (1959): Correlations between the Trail Making Test and the Wechsler-Bellevue Scale. Perceptual and Motor Skills 9: 127-130.
Riedel, H.
(1966): Untersuchung zur Abhšngigkeit des ZeitauflŲsungsvermŲgens vom
Lebensalter. Grundlagenstudien der Kybernetik und Geisteswissenschaften 7: 65-72.
Roth, E.
(1964): Die Geschwindigkeit der Verarbeitung von Informationen und ihr
Zusammenhang mit Intelligenz. Zeitschrift für experimentelle und angewandte Psychologie 11: 616-623.
Ruchalla, E., Schalt, E. and Vogel, F. (1985): Relations between mental performance and reaction time: new aspects of an old problem. Intelligence 9: 189-205.
Shands, H. C. (1959):
Adaptation
and information in psychiatry.
Journal of Nervous and
Mental Diseases 128: 204-213.
Smith, G. A. and Stanley, G. V. (1980): Clocking g: relating intelligence and measures of timed performance.
Intelligence 7:
353-368.
Spiegel, M. L. R. and Bryant, D. (1978): Is speed of processing information related to intelligence and achievement. Journal of Educational Psychology 70: 904-910.
Stabler, J. R. and Dyal, J. K. (1963): Discriminative reaction time as a joint function of manifest anxiety and intelligence. American Journal of Psychiatry 76: 484-487.
Sternberg, S. (1966): High-speed scanning in human memory.
Science
153: 652-654.
Stier, F.
(1969): ‹ber den Informationsgehalt manueller Zielbewegungen. Kybernetik 5: 209-219.
Stough, C. and Nettelbeck, T. (1989): Inspection time and IQ. The Psychologist 45: 374.
Vernon, P. A. and Jensen, A. R. (1984): Individual and group differences in intelligence and speed of information processing. Personality and individual differences 5:
411-423.
Von Baer, K. E. (1864): Welche Auffassung der lebenden Natur ist die richtige und wie ist diese Auffassung auf die Entomologie anzuwenden? St.
Petersburg: Schmitzdorf.
Von Helmholtz, H. I. F.
(1887): Zšhlen und Messen erkenntnistheoretisch betrachtet. In: Philosophische Aufsätze. Leipzig: Fues, pp. 1-28.
Von Uexküll,
J. (1928): Theoretische Biologie. 2nd ed. Berlin: Springer.
Waddell,P. A., Benjamin, L. and Kemp, S. (1985): Random number generation by normal subjects. Perceptual and Motor Skills †61: 710.
Wagenaar, W. A. (1972): Generation of random numbers by human subjects: a critical survey of literature. Psychological Bulletin 77: 65-72.
Wechsler, D. (1935): The Range of Human Capacities. London: Bailliere.
Weidenhammer, W. and Fischer,
B. (1985): Flimmerverschmelzungsfrequenz und Subjektives Zeitquant Ė sind sie
unabhšngige GrŲŖen? Grundlagenstudien der Kybernetik und Geisteswissenschaften/Humankybernetik 26: 51-60.
Weiss, V. (1984): Psychometric intelligence
correlates with interindividual different rates of
lipid peroxidation. Biomedica and Biochimica Acta 43: 755-763. – see update
http://www.v-weiss.de/majgenes.html and
http://www.v-weiss.de/intellig.html
Weiss, V. (1986): From memory span and mental speed toward the quantum mechanics of intelligence. Personality and individual Differences 7: 737-749. – see update
http://www.v-weiss.de/publ9-e.html
Weiss, V. (1987): The quantum mechanics of EEG-brain dynamics and short term memory.
Biologisches Zentralblatt 106: 401-408. Ė see update
http://www.v-weiss.de/chaos.html
Weltner, K. (1987): The Measurement of Verbal Information in Psychology and Education.
Heidelberg: Springer.
Weltner,
K. (1987): Messung des Zeitbedarfs fŁr elementare VerknŁpfungsoperationen. Grundlagenstudien der Kybernetik und Geisteswissenschaften/Humankybernetik 28: 37-45.
Wenzel, F. (1961): ‹ber die
Erkennungszeit beim Lesen. Kybernetik 1: 32-36.
Westhoff,
K. and Kluck, M.-L. (1983): Zusammenhang zwischen Intelligenz und
Konzentration. Diagnostica
23: 310-319.
Wingfield, A. (1965):† The identification and naming of objects. Diss.,
Oxford.
Wolfram, H.,
Neumann, J. and Wieczorek, V. (1986): Psychologische Leistungstests in der Neurologie und Psychiatrie. Leipzig: Thieme.
Wundt, W. (1874): Grundzüge der Physiologischen Psychologie.
Leipzig: Engelmann.
APPENDIX
How to administer the
letter-reading task and derive a testeeís BIP
There are several measures for BIP and Ck
and Ė via these magnitudes Ė for the IQ. Among all the administered measures
ĎLetter readingí was developed as a test because it proved to be sufficiently
objective, reliable (Tables 3 and 4 ), valid (Tables
1, 2, 3, and 5; Figure 3), and practicable (Table 4). Its acceptance by testees is high.
Letter reading consists of four cards (each 15 x 21 cm). In the middle
of each card is a line of 20 independent letters, having phonetically only one
syllable. The size of each line is 0.7 x 18 cm. The first card in the German
basic version of letter-reading follows. This and all other cards may also fit
the English administration.
w n r z t r f e p k b v d s n i l d m r
The
subject is simply asked to read a series of mixed up letters in an undertone as
quickly as possible. The he or she obtains the first card with the back
upwards. As soon as the testee has reversed the card and begins to speak, the
stopwatch is started. The time from the first to the last spoken letter is
measured. It should be documented in tenths of a second, e.g. 7.3 s.
If
the subject has repeated one or more letters or has delayed for other reasons,
he or she is asked to continue even if there are mistakes. Then the next of
three similar cards with other letters is given. The corresponding German
versions are
I P L
Z M B E O A E H I O A Z T L E A V
m
j z t f r d s i h d o l t k g d e r i
E C X S B T L K E O G F D E A V I M H P
†† The
total procedure takes about 1-3 min. Only the best time counts. When evaluating
the raw scores it must be remembered that a subject can only perform full
binary decisions. Therefore, the recognition of a letter out of the repertoire
of 27 letters, which theoretically has an information content of 4.7 bits (27 =
24.7), needs five binary decisions. Since each letter contains 5
bits of information, the 20 letters contain 100 bits. This is divided by the
time of reading to obtain the amount of information processed in a second Ck
(bit/s). For example, if the best time of a testee is
7.3 s, then Ck = 100/7.3 (bit/s) = 13.7 bit/s. 1000 ms/Ck equals the BIP (ms). In this example, BIP = 137 ms
(and likewise, the Ďpsychological momentí).
††† By standardizing ‘letter reading’ on adults, normative data are available for BIP and Ck (Table 5).
By Table 5 an additional allocation to IQ is also possible.
Table 5.††
Normative data of duration of basic period of information processing
(BIP) and mental speed Ck measured by the test ĎLetter readingí
|
|
Percentile
|
IQ
|
1 BIP(ms)
|
Ck (bit/s)
|
|
99.8
|
140
|
††††† -41
|
25
|
|
99.7
|
135
|
††††† -42
|
24
|
|
98.8
|
130
|
† 43-47
|
23
|
|
96.5
|
125
|
† 48-49
|
21
|
|
93.0
|
120
|
† 50-54
|
19
|
|
86.0
|
115
|
††††† -55
|
18
|
|
75.0
|
110
|
† 56-57
|
17
|
|
59.2
|
105
|
† 58-63
|
16
|
|
50.0
|
100
|
† 64-68
|
15
|
|
40.8
|
† 95
|
† 69-71
|
14
|
|
25.0
|
† 90
|
† 72-78
|
13
|
|
16.0
|
† 85
|
† 79-87
|
12
|
|
† 7.0
|
† 80
|
† 88-93
|
11
|
|
† 3.5
|
† 75
|
† 94-124
|
† 9
|
|
† 1.2
|
† 70
|
125-
|
†-8
|
|
††††
Although an exhaustive representative inquiry is still lacking, there are indirect estimates of representative values: the parameter BIP (respectively Ck) was measured together with scores on a vocabulary intelligence test which had been standardized on 1952 representative Western German adults in 1974 [for further details see Lehrl et al., (1990)] . The sample consisted of 672 adults (310 females; age: 42.7 ± 21.1 years; IQ 105.6 ± 21.7 years). Within the range of
17-65 years no relevant relation with age was noticed.
†††
Subjects in IQ intervals of 5 points (68-72, 73-77, 78-82, 83.87, etc.) were aggregated and their medians in BIP and Ck calculated. The results were
the norms given in Table 5 and the regression lines in Figure 3. Because the
connections are linear in the interval from IQ 80 to IQ 120, Jeske, Lehrl and Frank (1982) suggested the following rule
of thumb for a quick determination of IQ. IQ = 5 Ck (bit/s) + 25,
valid for 11 < Ck < 19, i.e. 80 < IQ < 120.
†††† As
an estimate of the scatter, the standard deviation of Ck was
determined for the values. which are allocated to the
(representative) IQ 115 and IQ 85. The resulting difference was divided by 2.
The result is mean (Ck) = 15.0 bit/s; sd = 3.1 bit7s. BIP : mean = 66.7 ms; sd
= 19 ms.
The
normative data in Table 5 are also valid for the parallel version of
Letter-reading, which consists of the lines
d f z k v b r x p l y t a s n d c o g
h
L P H M O T V F R G S
X E B A K M I D Z
n z k f v s c u l t p m a g x i r y b d†
V T B U R K Z F C D P L M S E N I X O Y
There
are virtually no systematic retest effects, especially if the parallel version
is applied and/or if the interval between two measurements is large (cf. Lehrl
et al., 1990).
†††
Findings from Spanish speakers provide some evidence that the norms are
valid for people from different language areas (Carena,
1985). For Spanish, letters were omitted which are spoke with more than one
syllable (e.g. Ďwí), because in these cases speaking lasts longer than
perceiving and thus determines the registered time. Normally, as has been shown
(Lehrl et al., 1990), recognizing the new letter already begins while the
previously perceived letter is spoken, indicating a parallel process.
Home